Interaction data
This chapter will explain: news and conversation interaction related concepts, indicators and how to view the trend graph.
Assuming that your agent is online and having dialogue with users every day, you might want to see the interaction data between your agent and users to help you understand the performance of the agent.
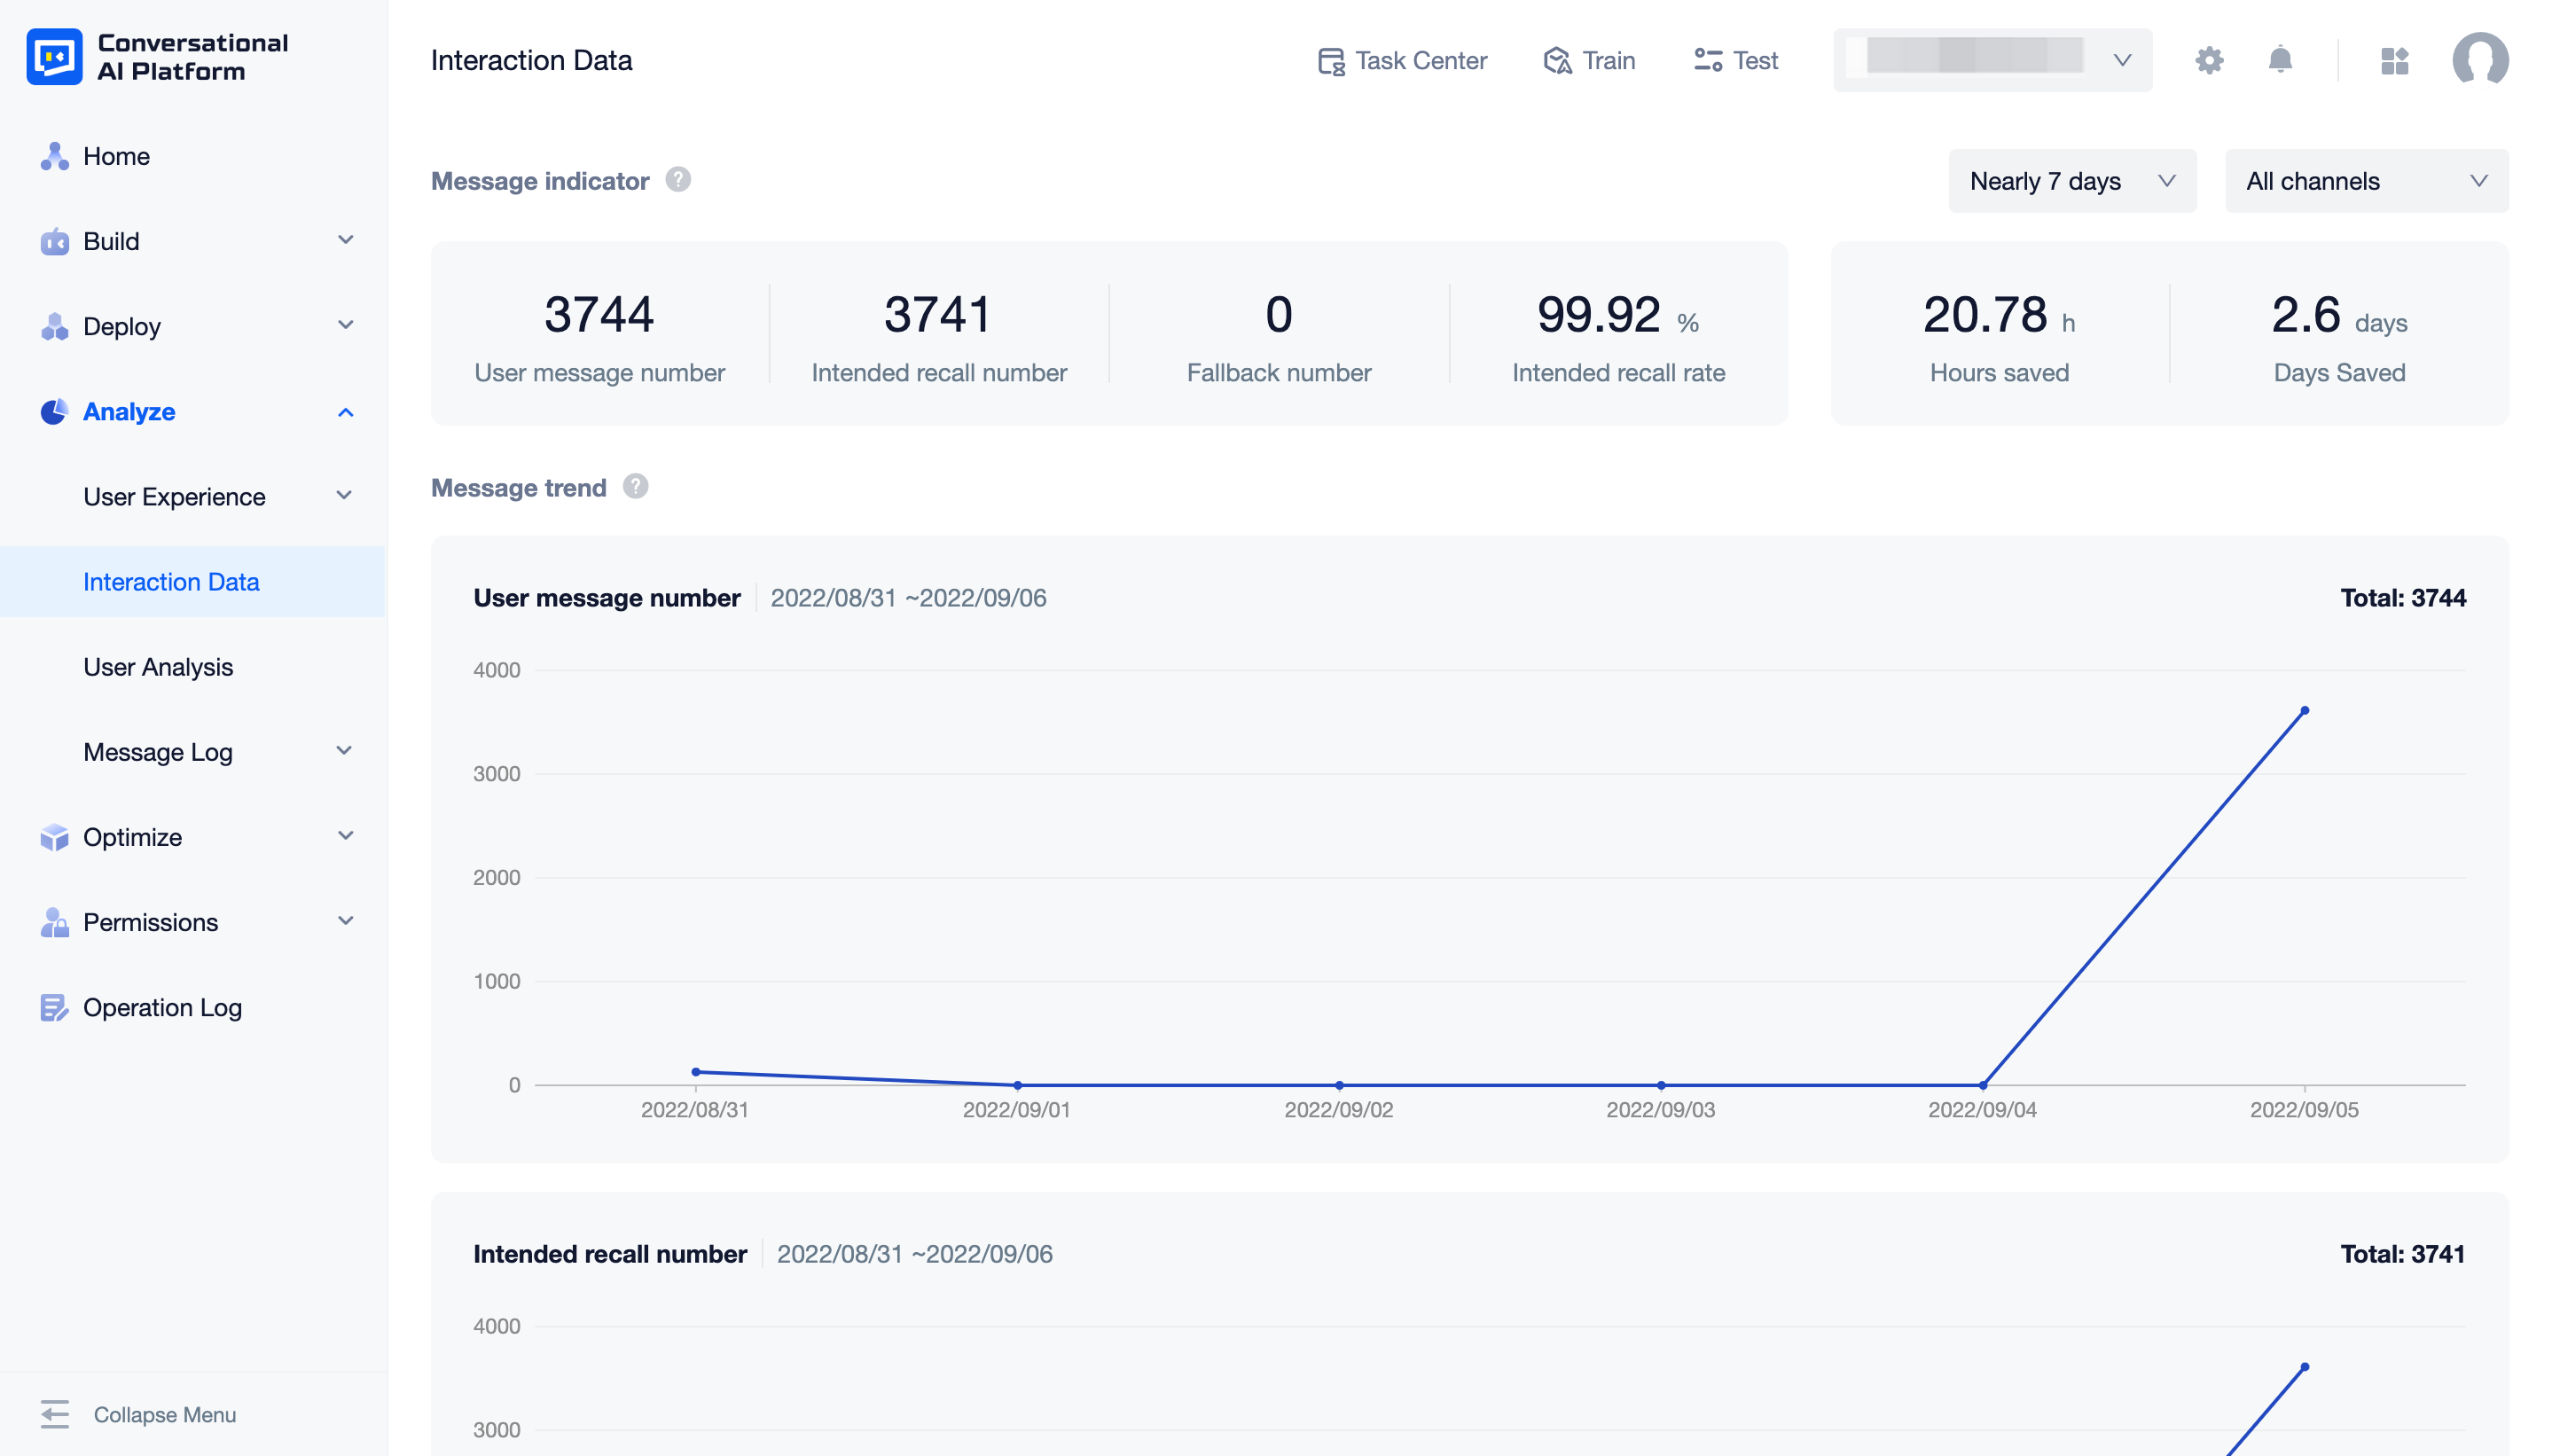
The interactive data page of the system provides key indicators of the interaction between the user and the agent. On this page, you can view:
- Message indicator: indicators around the intention to recall or not
- Message trend: Time trend graph of news indicators
- Hours saved: the time to manually reply to a message (20s by default) times the number of recalled intents, unit of measurement: hour, man-day
Indicators and analysis

Message indicators
Message indicators, centered on whether the intention is recalled or not, display today’s real-time situation by default:
- User message number: the number of messages sent by users
- Intended recall number: the number of intentional recalls
- Fallback number: the number of times the bottom of the pocket was recalled
- Intentional recall rate: number of intentional recalls/number of user messages*100%
Message trend
The message trend includes the number of user messages, the number of intentional recalls, the number of bottom replies, and the trend graph of the intentional recall rate over a period of time, which can be viewed by filtering a certain period of time in the upper right corner.
Hours saved
The time saved by the agent refers to the time that the agent can actually help the user save (the default is 20s for a manual reply to a message).