Dashboard
The Dashboard is used to quickly understand RPA operation and quickly handle RPA matters. It is divided into three modules:
Today's Task
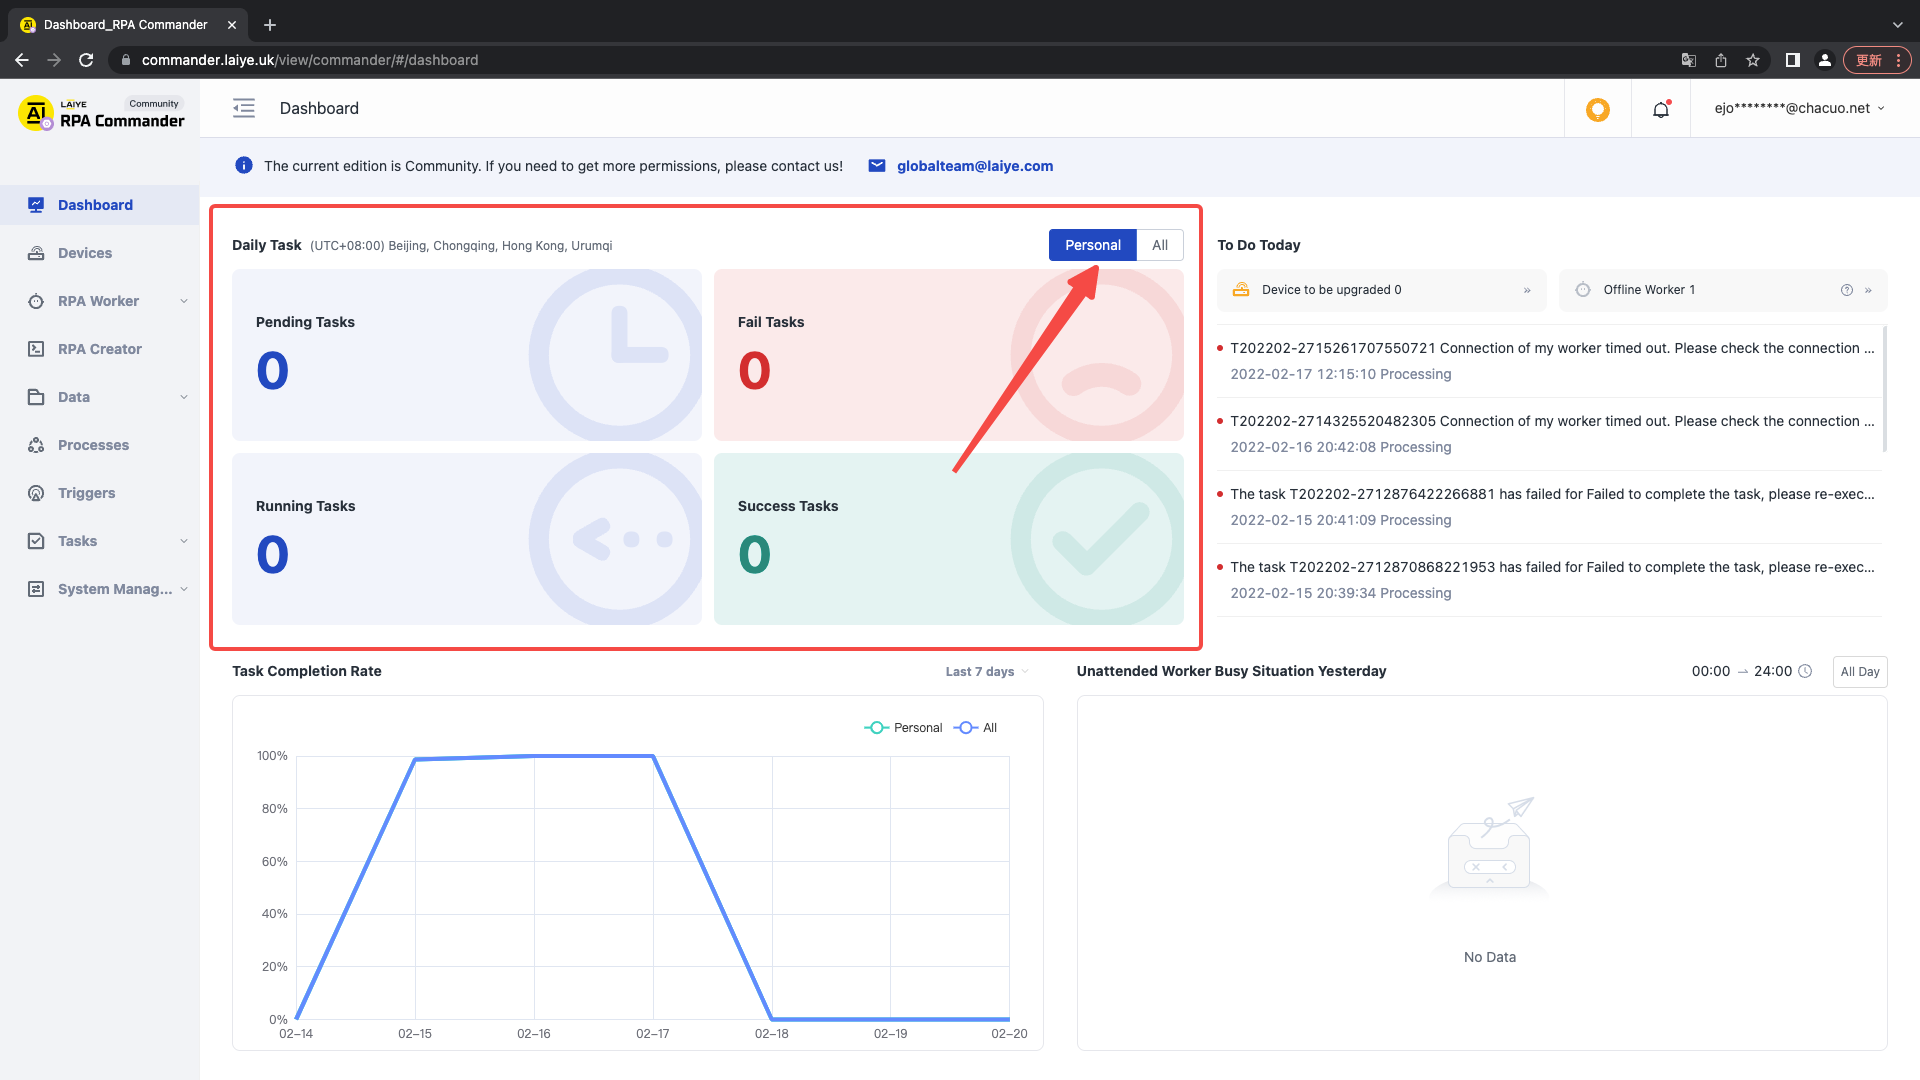
Today's Task include statistics of Task to be run, failed Task, running Task, and successful Task, where
| Indicator name | explain |
|---|---|
| To run Task | It refers to the total number of Task that the current user is waiting to run. Click to view the details |
| Failed Task | It refers to the statistical total number of Task that the current user failed to run. Click to view the details |
| Running Task | It refers to the statistical total number of Task running by the current user. Click to view the details |
| Successful Task | It refers to the total number of Task successfully run by the current user. Click to view the details |
Note: the above data will be counted according to the current user's time zone from 0:00:00 to 23:59:59, of which the person in the upper right corner is the current user's own statistics, and All are the Task statistics within the current user's permission.
Click the corresponding statistics to jump to the Individual Task to view the details.
To do today
Displays the items you need to deal with today, including the Device to be upgraded, the offline workers and the recently unread system messages.
The Device to be upgraded refers to the Device whose client version of the Device is lower than the latest version of the current system. Click to enter the Device Management Office for Device upgrade.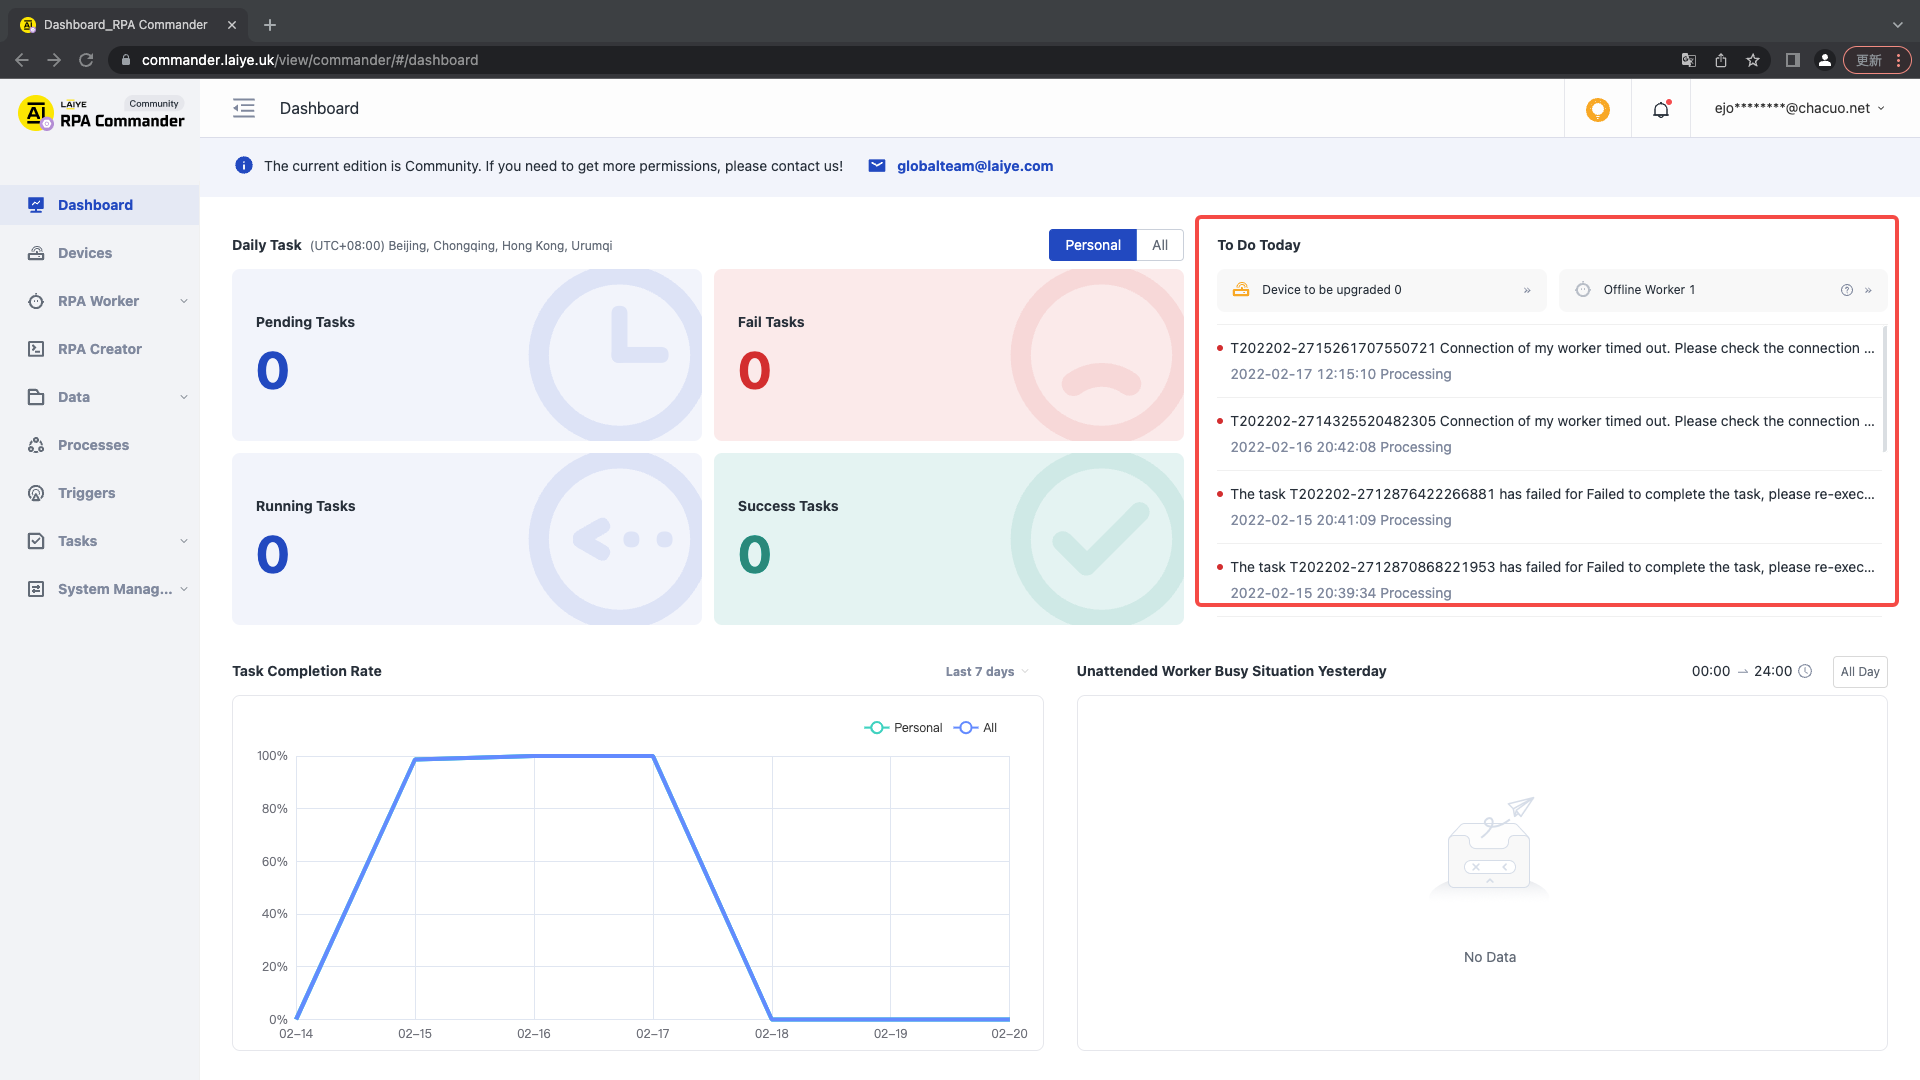
Data card
Data card - Task running success rate It displays the average rate of Individual Task in the last 7 days. You can switch to view the recent 30 days and the success rate of all All Task.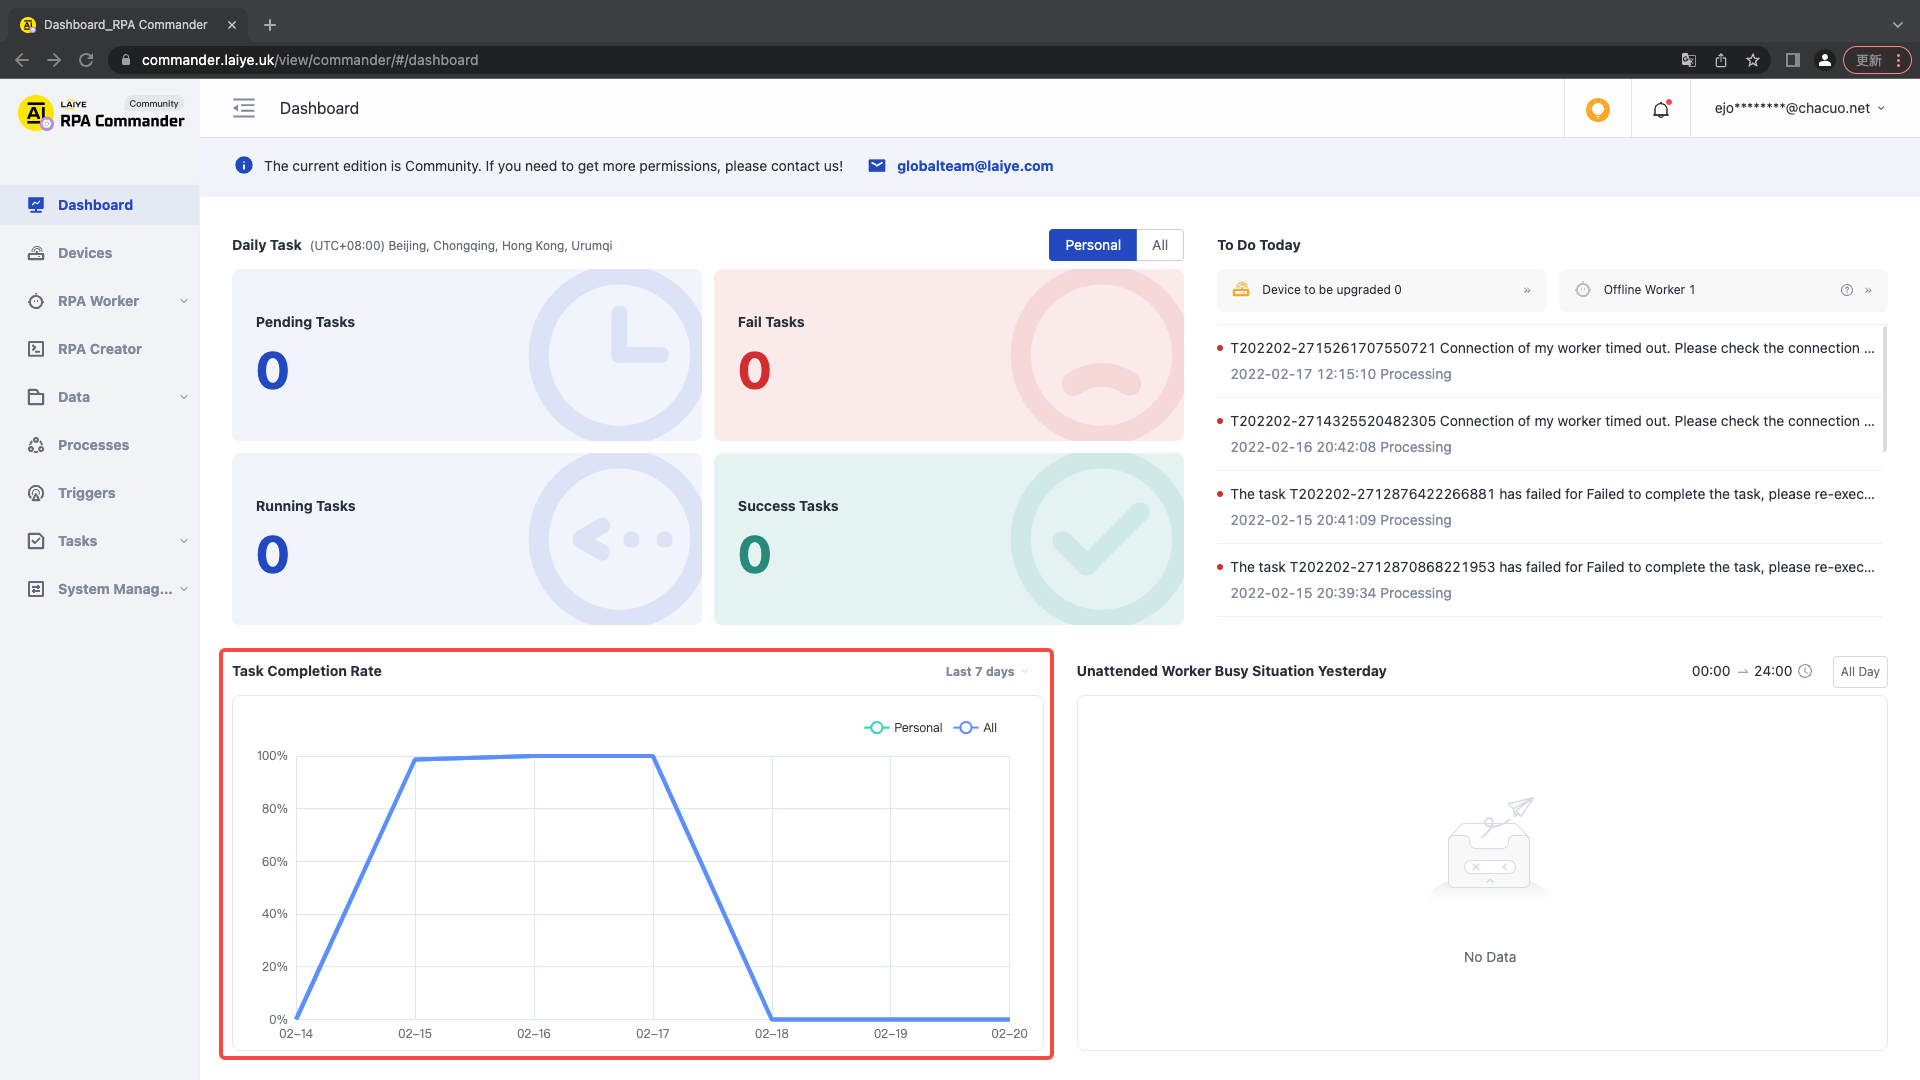
| Indicator name | explain |
|---|---|
| Success rate of Task operation | It refers to the percentage of successful times of Process operation in "successful times of operation + failed times of operation", with 2 decimal places reserved. |
| Nearly 7 days | It refers to the running success rate data of the current user's Task from yesterday to the previous 7 days. |
| Nearly 30 days | It refers to the running success rate data of the current user's Task from yesterday to the previous 30 days. |
The above data will be counted in the current user's time zone
Data card - busy condition of Unattended yesterday The user can view the busy status of the worker agent within the user authority within 24 hours of yesterday.
| Indicator name | explain |
|---|---|
| Busy situation | It refers to the percentage of successful times of Process operation in "successful times of operation + failed times of operation", with 2 decimal places reserved. |
The above data only shows the top10 Unattended within the current user permission.
Personal Center
Modify user name
Click "modify user name" and enter the correct user name to modify it successfully. The format of user name is letter + number, which cannot start with a number and is between 5-25 characters in length.
Change Password
Click "modify password", enter the correct old password and confirm the new password twice, and then you can modify the password. The password length cannot be less than 8 digits.
Modify mailbox
Click "modify email", and the modification will be successful after passing the verification code.
Language switching
Click "language switch" and select the corresponding language. After the system is refreshed, it will be displayed in the selected language.
Log out
Click the "exit login" button to exit the current account.
Novice guidance
Click the novice guide to see the operation guide of the Laiye RPA Commander product. Click "go to download laiye RPA installation package" to jump to the official website of laiye to download the latest client.
Message center
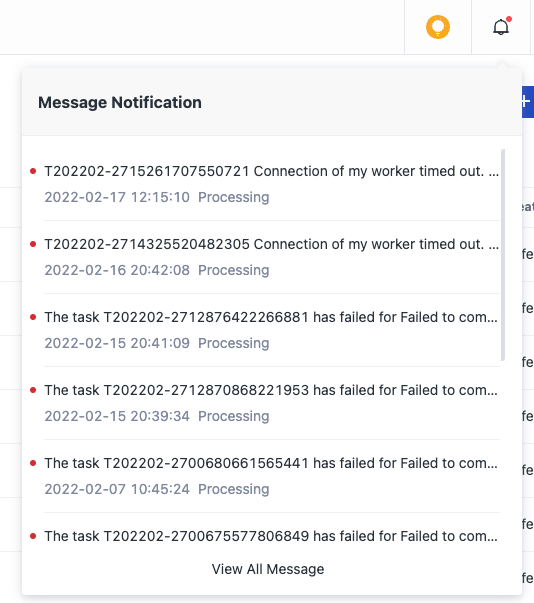
Click the message center to view the latest unread messages. Click a single message to jump to the message pointing page.
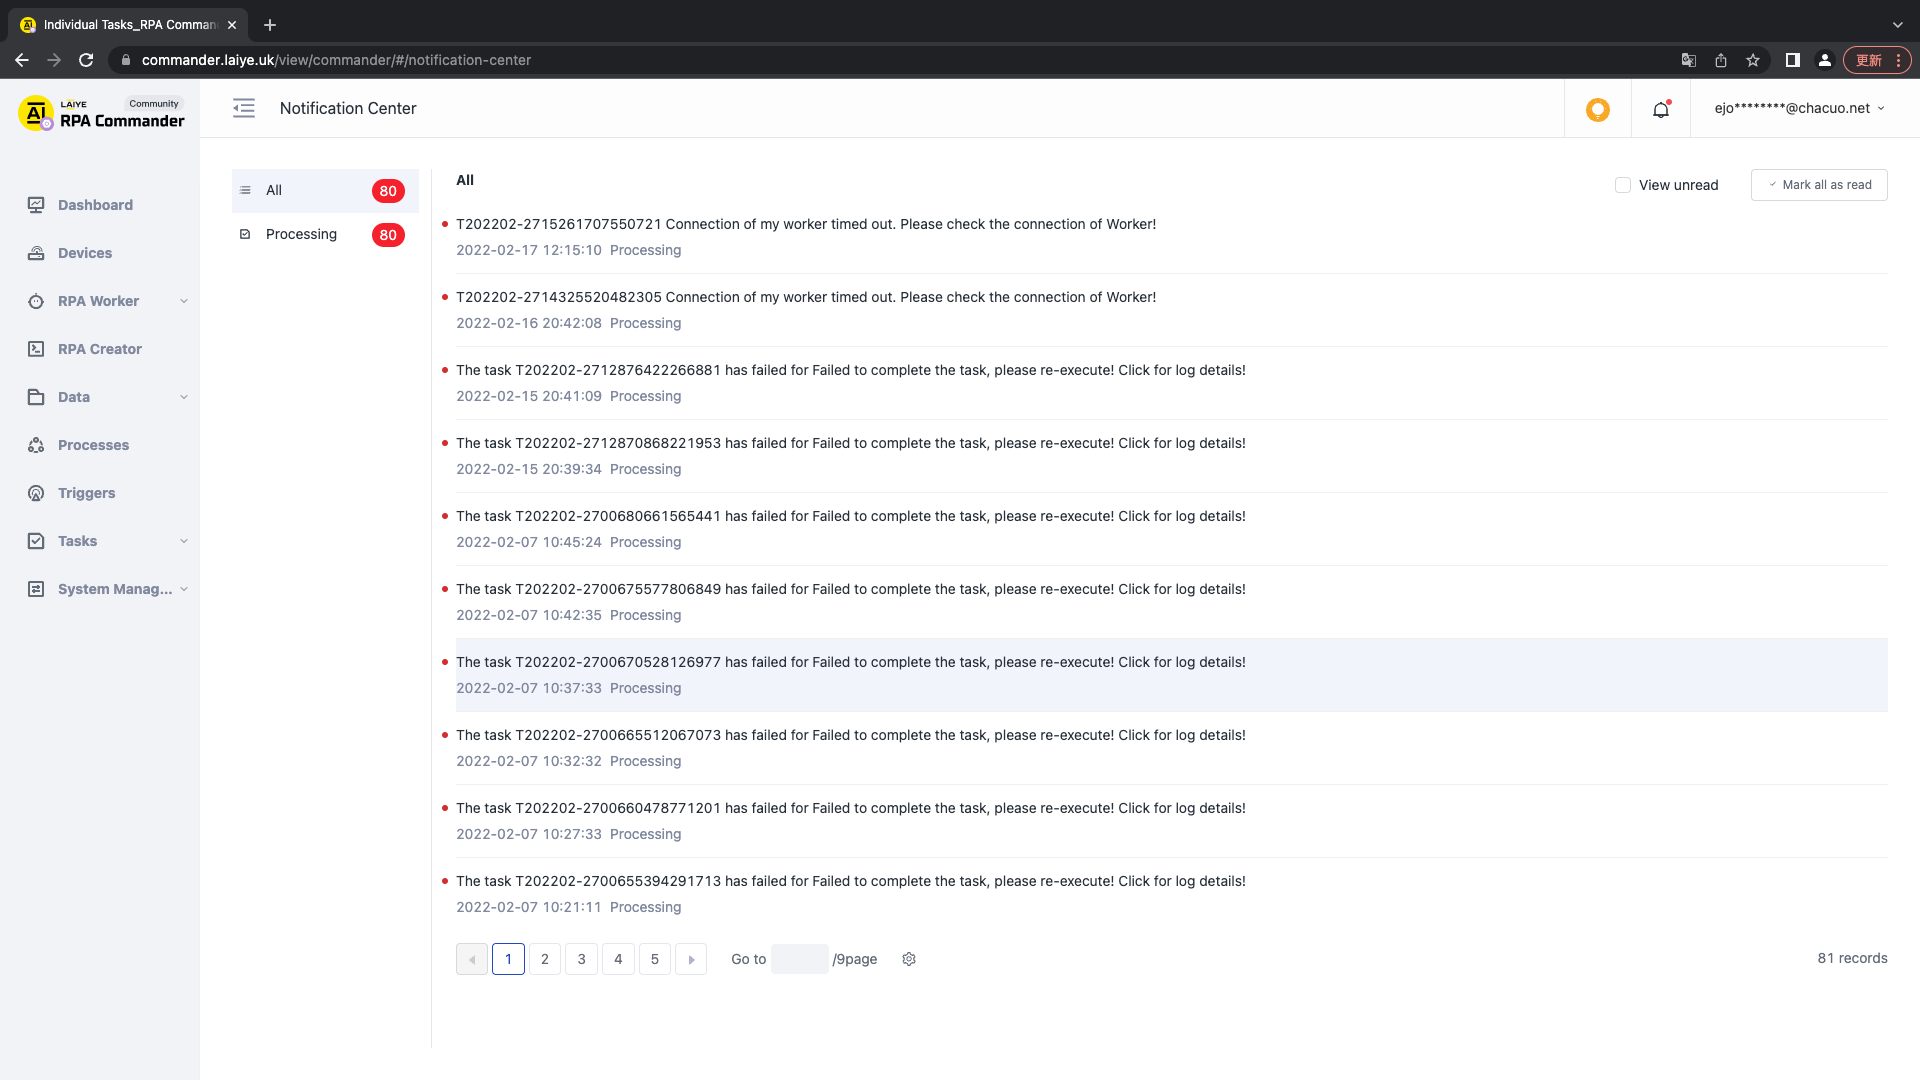
Click "view more" at the bottom of the message pop-up window to view all historical All messages.