Real-time Monitoring
Real-time Monitoring
Through Real-time Monitoring, managers can monitor the operational status of Automation Workers in real time, manage tasks being executed by the workers, and provide status alerts to help users quickly identify issues and manually control abnormal situations, improving efficiency in problem resolution.
info
The [Real-time Monitoring] page only displays the Real-time Monitoring cards of workers within your organizational permission scope. If you need to monitor other workers, please contact the respective worker’s owner to add you as a collaborator.
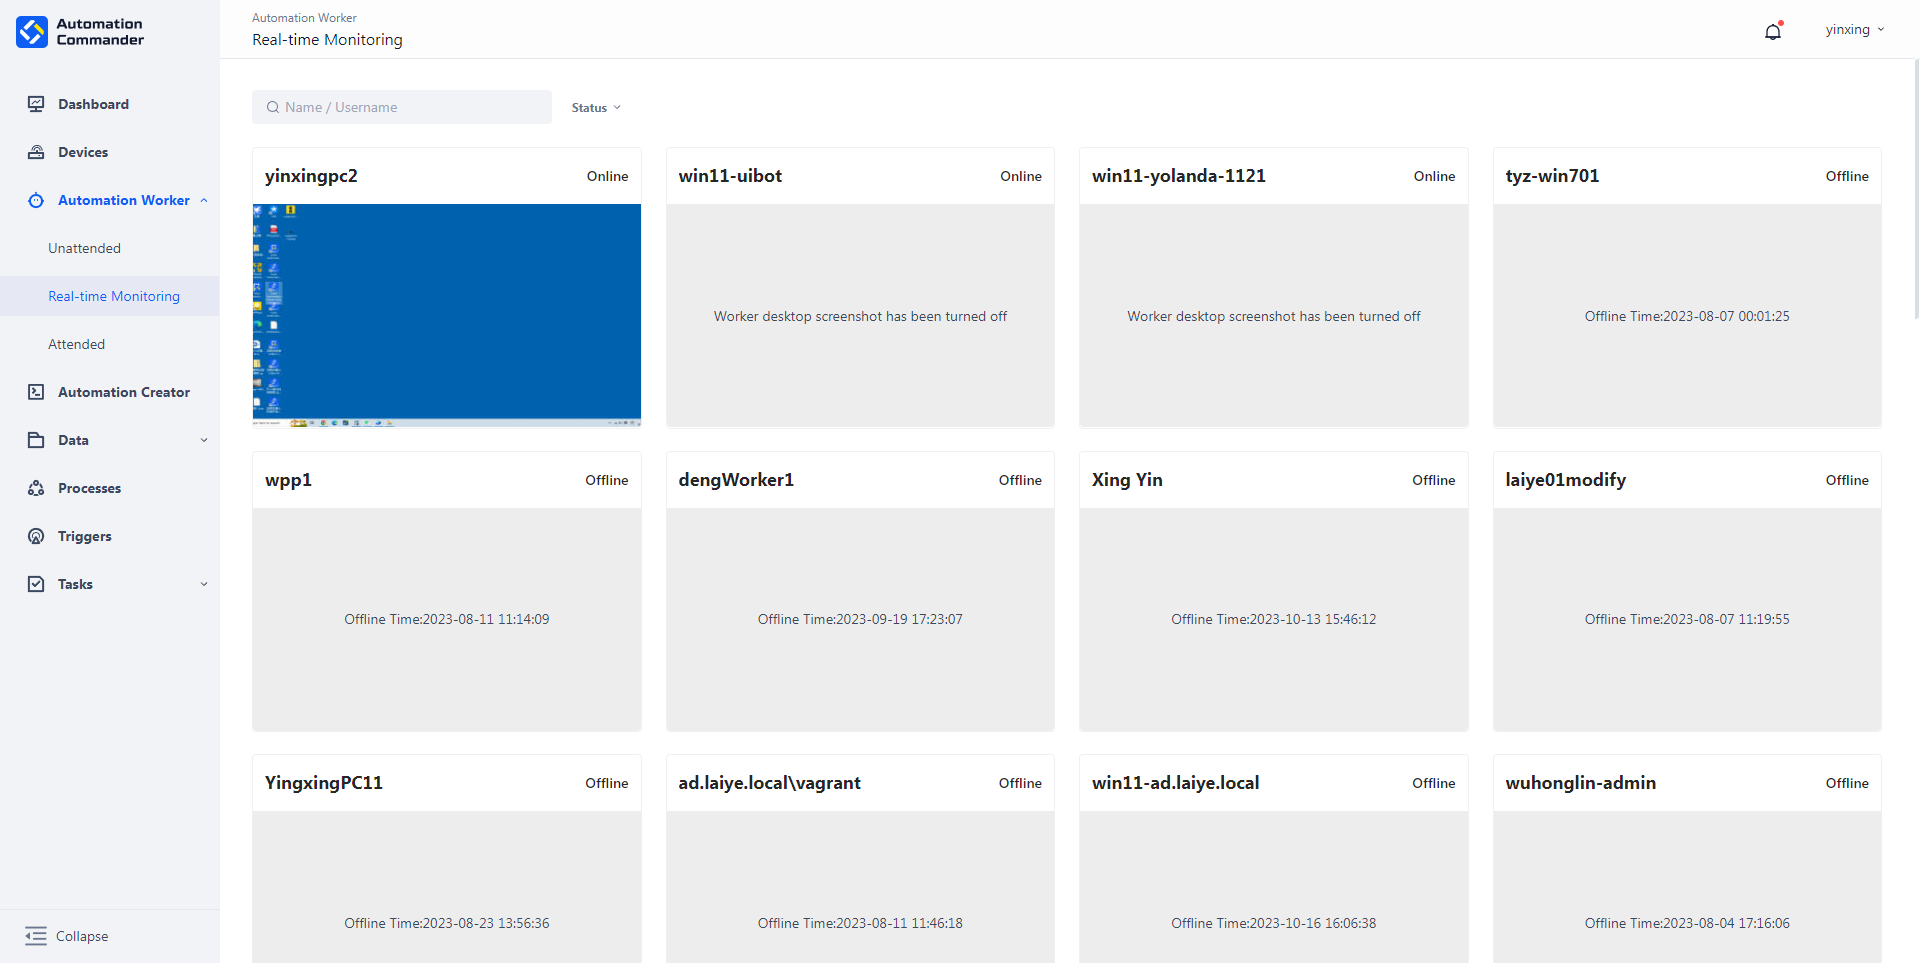
Only Real-time Monitoring Unattended-Automation Worker types are supported. Each worker is displayed as a card on the [Real-time Monitoring] page, and the information shown varies depending on the worker's online status and settings:
- When the worker is online and the "Enable periodic desktop screenshot uploads" option is enabled, static snapshots of the device will be updated on the card every 30 seconds.
- When the worker is online but the "Enable periodic desktop screenshot uploads" option is disabled, the card will display "Automation Worker desktop screenshot feature is disabled."
- When the worker is offline, the card will display "Offline..."
Query
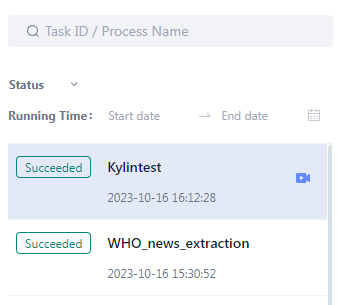
You can query workers by their status (online/offline), name, machine code, or username.
Details
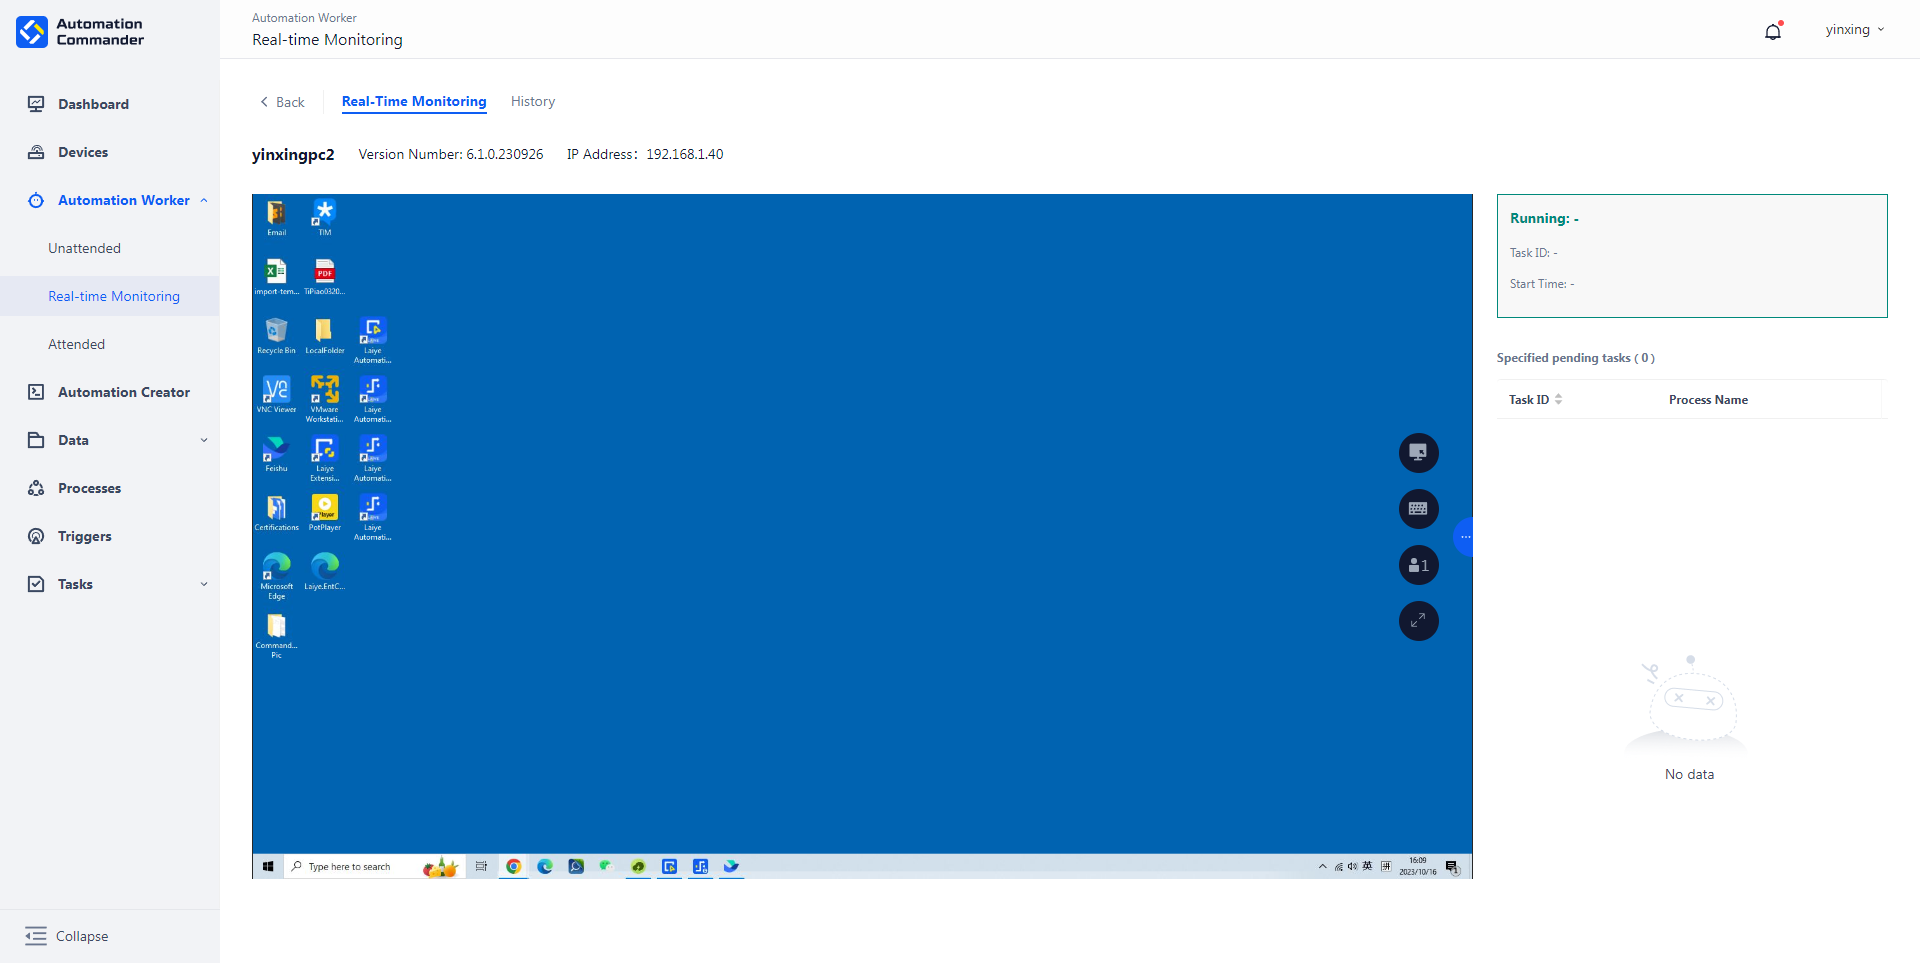
Click on the Real-time Monitoring of a specific Automation Worker in the list to enter its dedicated monitoring interface. Here, you can remotely control the worker, view tasks currently being executed, pending tasks, and historical records.
Details - Real-time Monitoring
When an Automation Worker is online, clicking on its card in the list allows you to view its Real-time Monitoring screen. If there are processes running, the task ID and process name will be displayed. You can also view the list of pending tasks for the specific worker.
Real-time Monitoring supports the following operations:
- Real-time monitoring of Automation Worker.
- Real-time remote control of the worker's device using mouse and keyboard.
- Viewing members simultaneously operating the worker.
- Full-screen viewing.
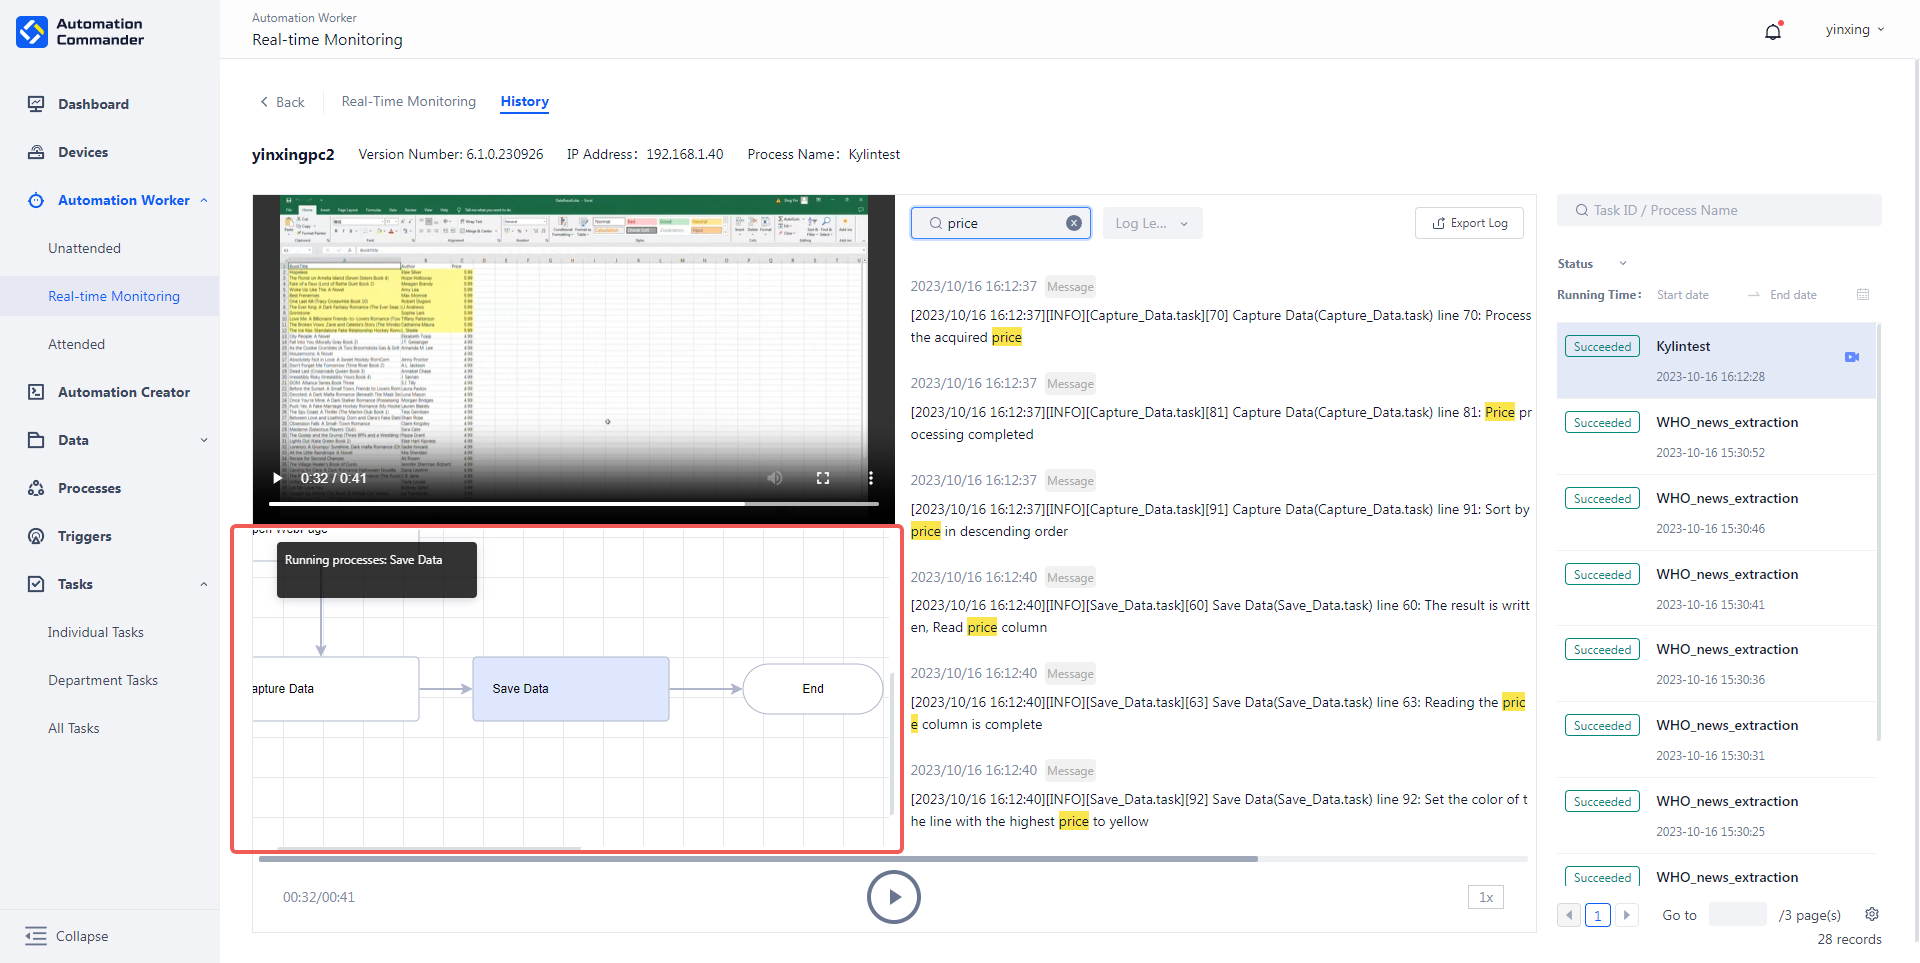
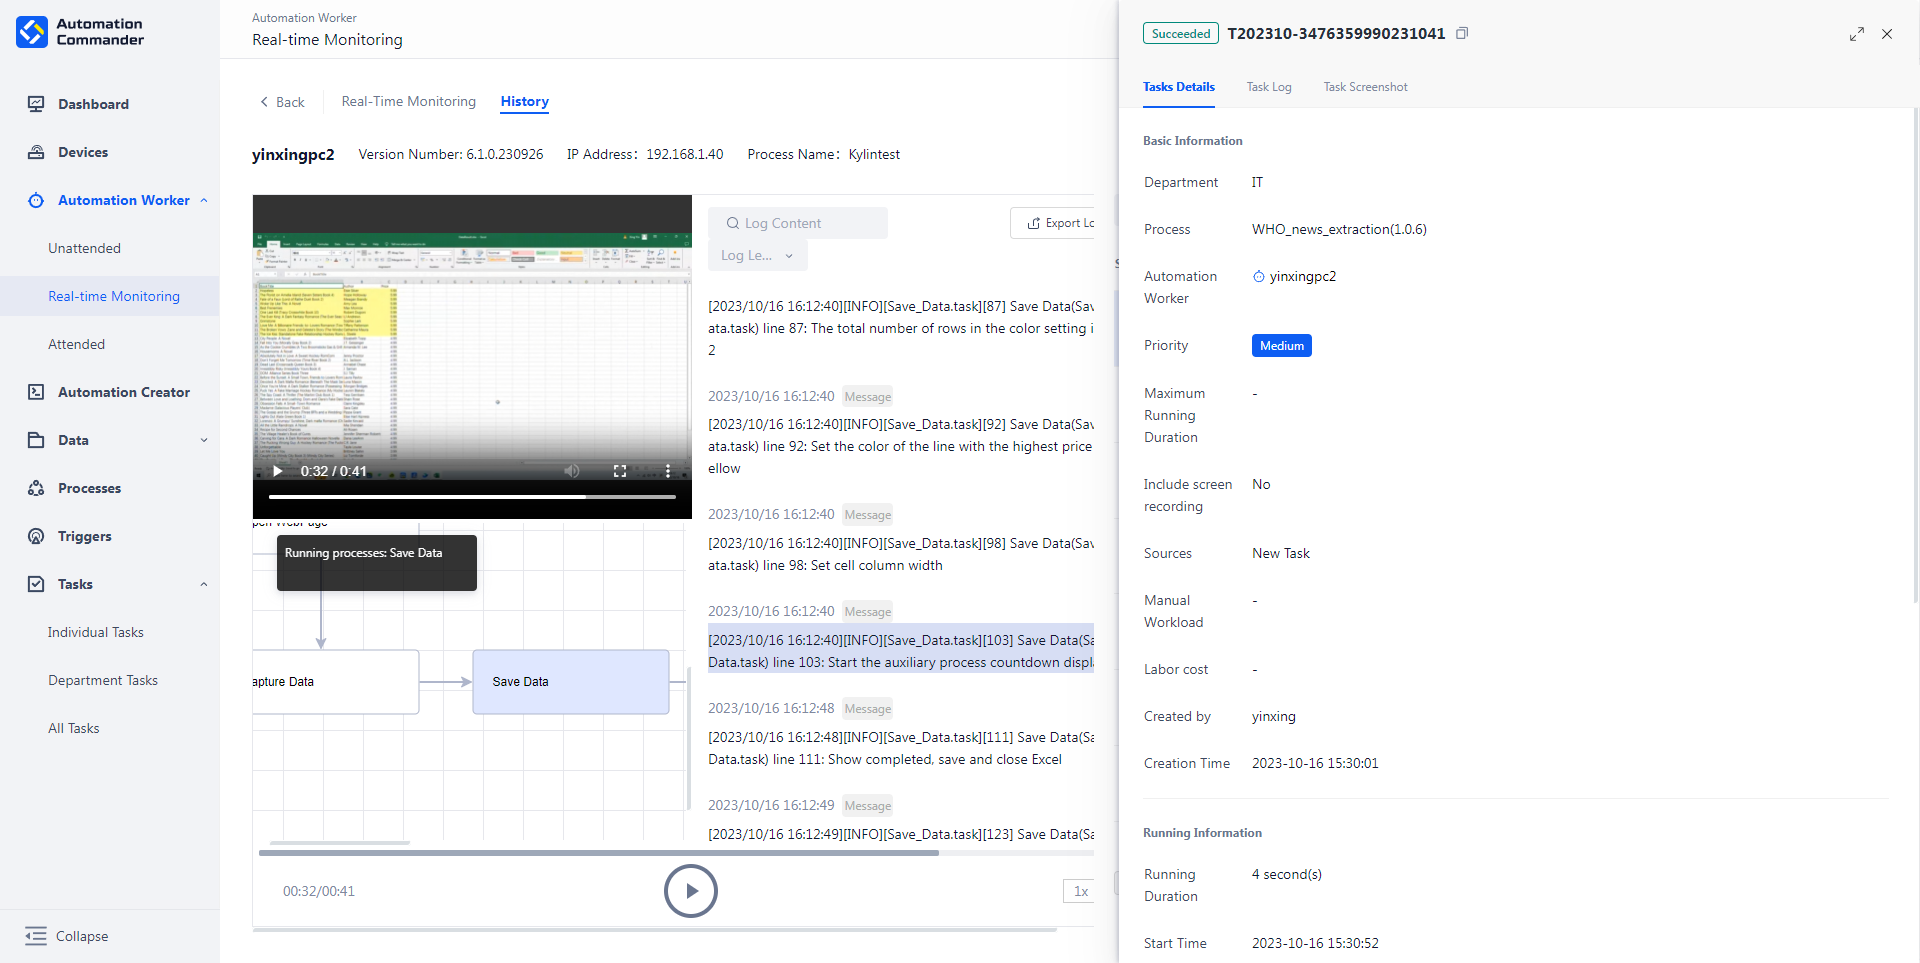
Details - Historical Records
You can view the task history of the Automation Worker here. If the worker has uploaded recordings, you can play them by clicking the play button on the task list information. For Automation Workers version 6.0.0.221121 and above, during playback, the corresponding logs and flowcharts are also synchronized and played simultaneously.
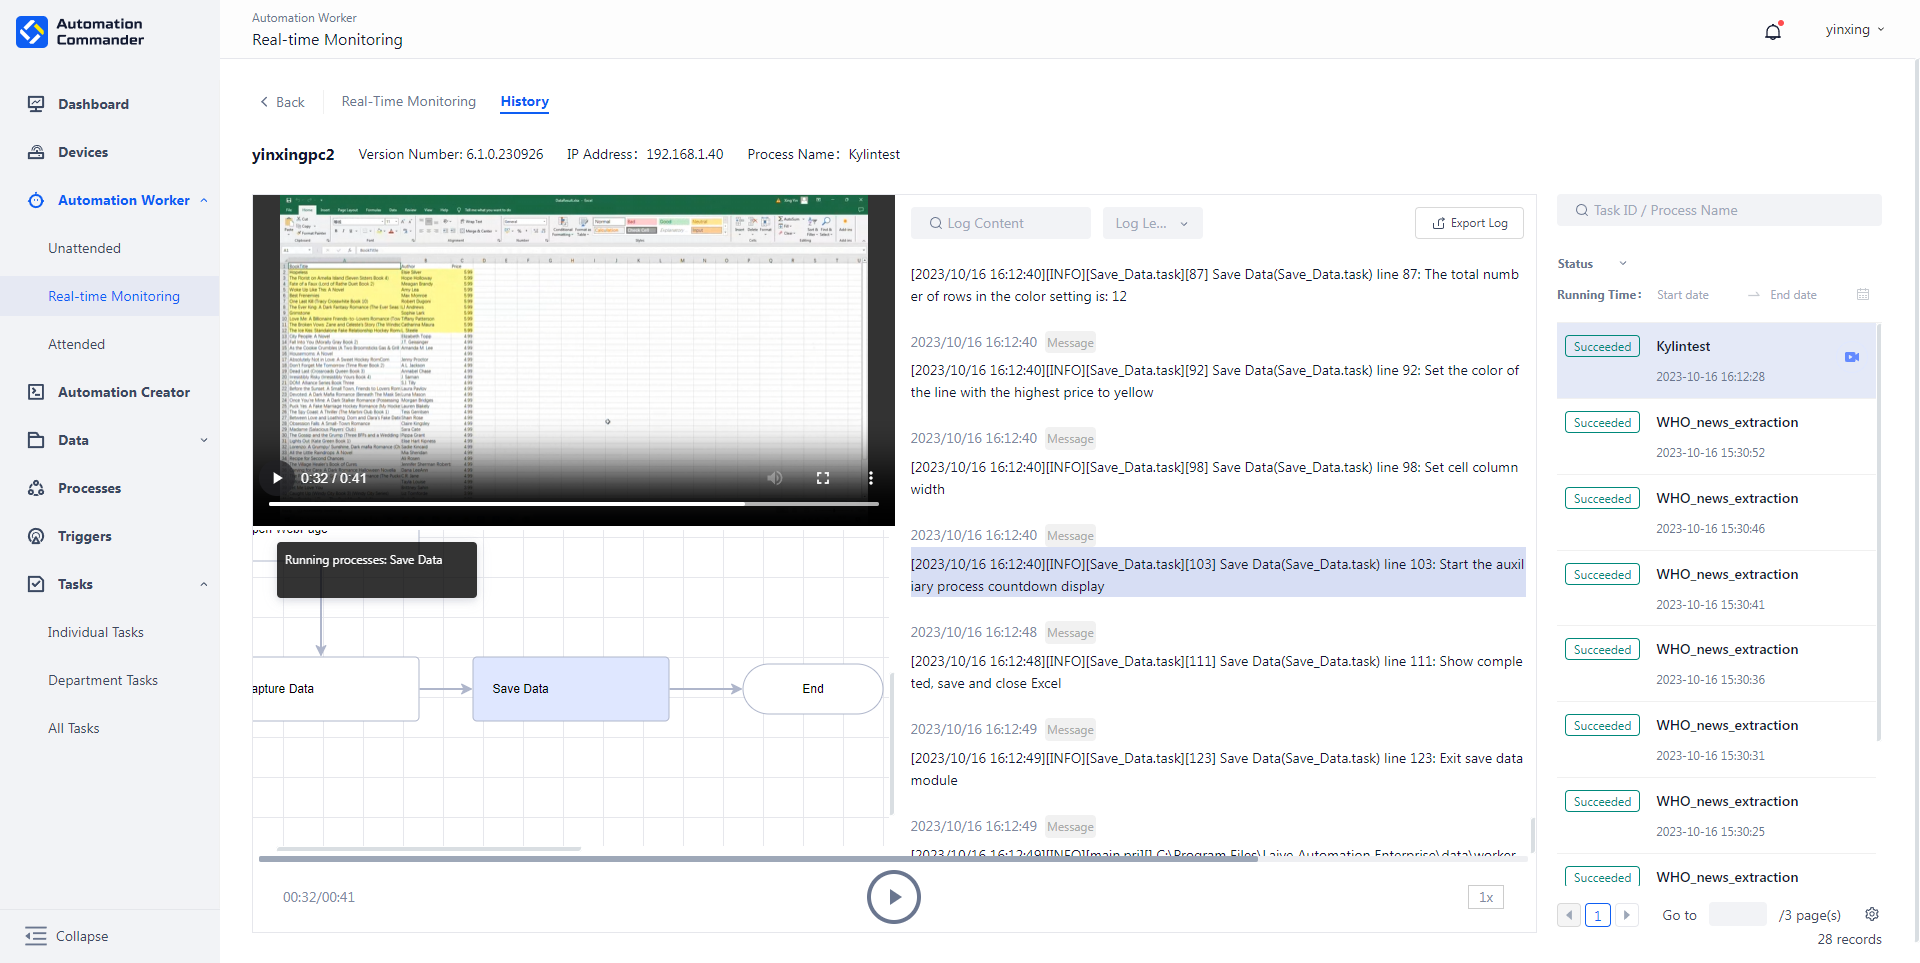
When recordings, logs, and flowcharts are played together, you can control them using the following features:
- Global Operations
If you need to switch the displayed task content, click the play button on a task in the right-hand task list to switch.
In the task list, you can filter and locate tasks by task ID/process name and task status.
Using the "Run Time" filter, you can view tasks within a specified time range.
Clicking on a task in the list allows you to view its details, logs, and screenshots.
- Recording
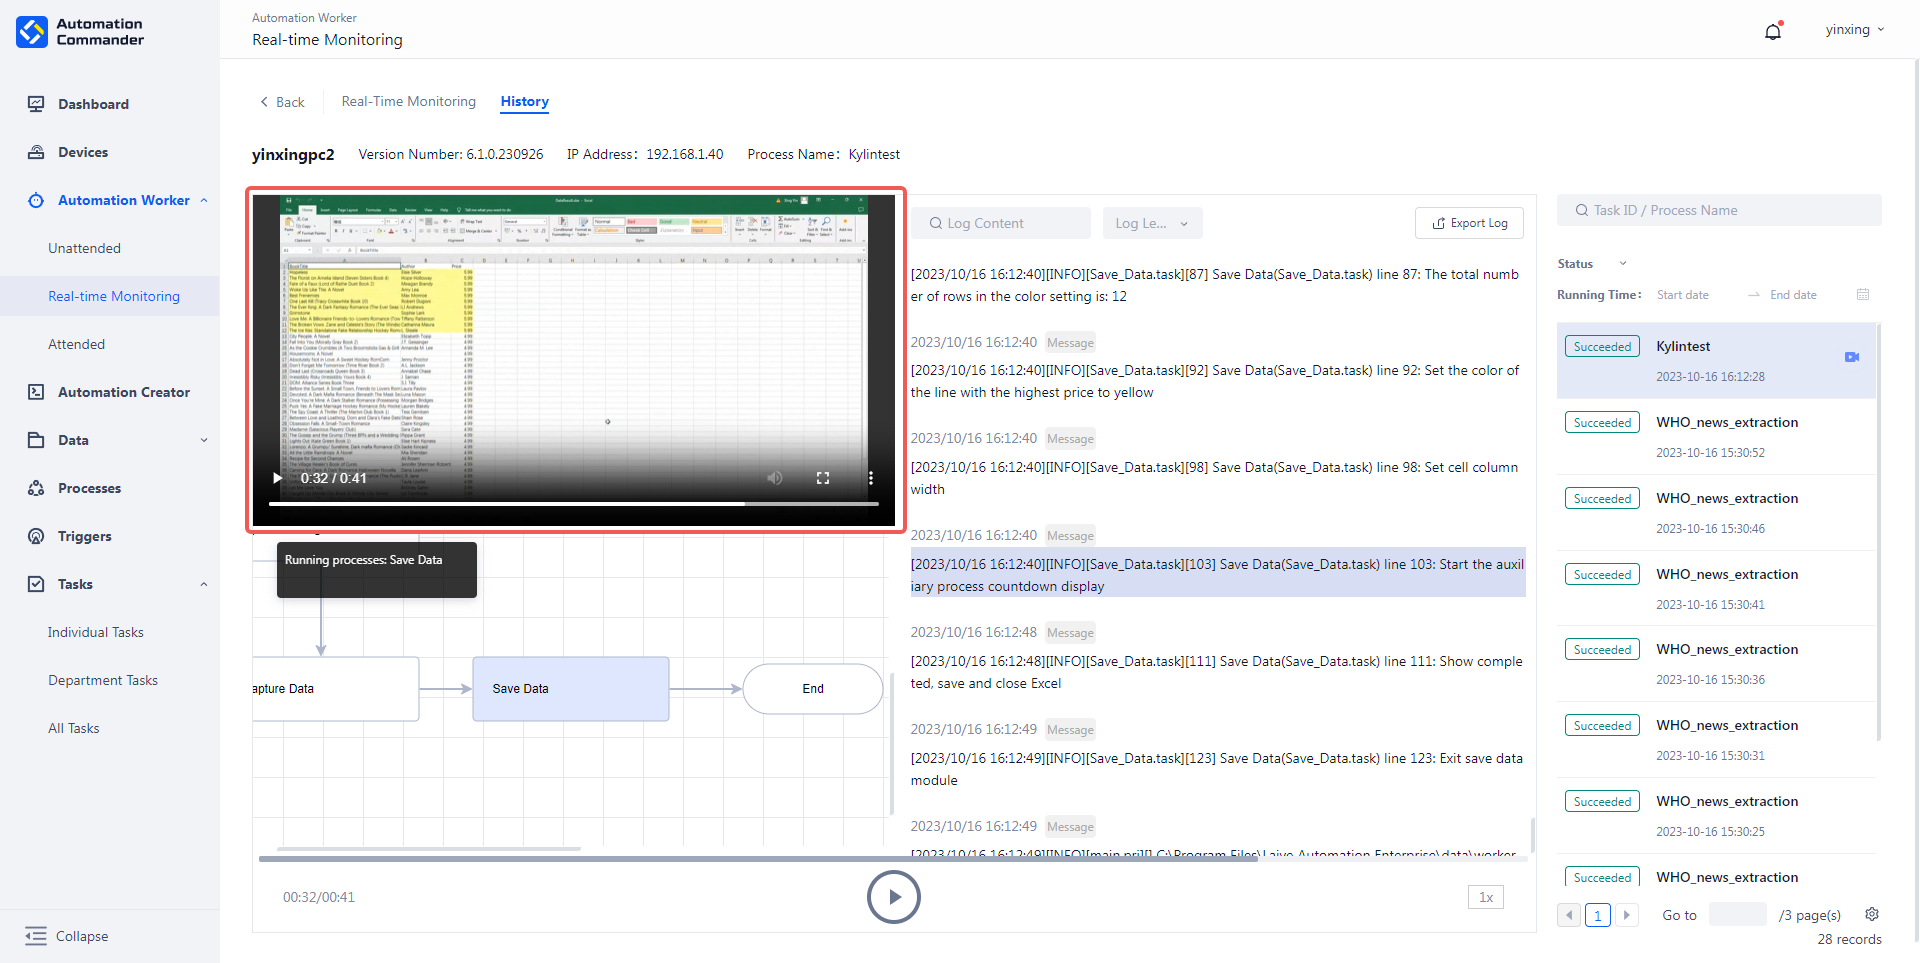
Click the play/pause button below or the play/pause button at the bottom left of the recording to control playback.
Click the maximize button at the bottom right of the recording to play it in full screen. In full screen mode, logs and flowcharts will no longer be displayed.
Click the more options button at the bottom right of the recording to control playback speed, selecting values between 0.25x and 2x speed.
Use the progress bar below the recording to quickly jump to a specific point.
- Logs
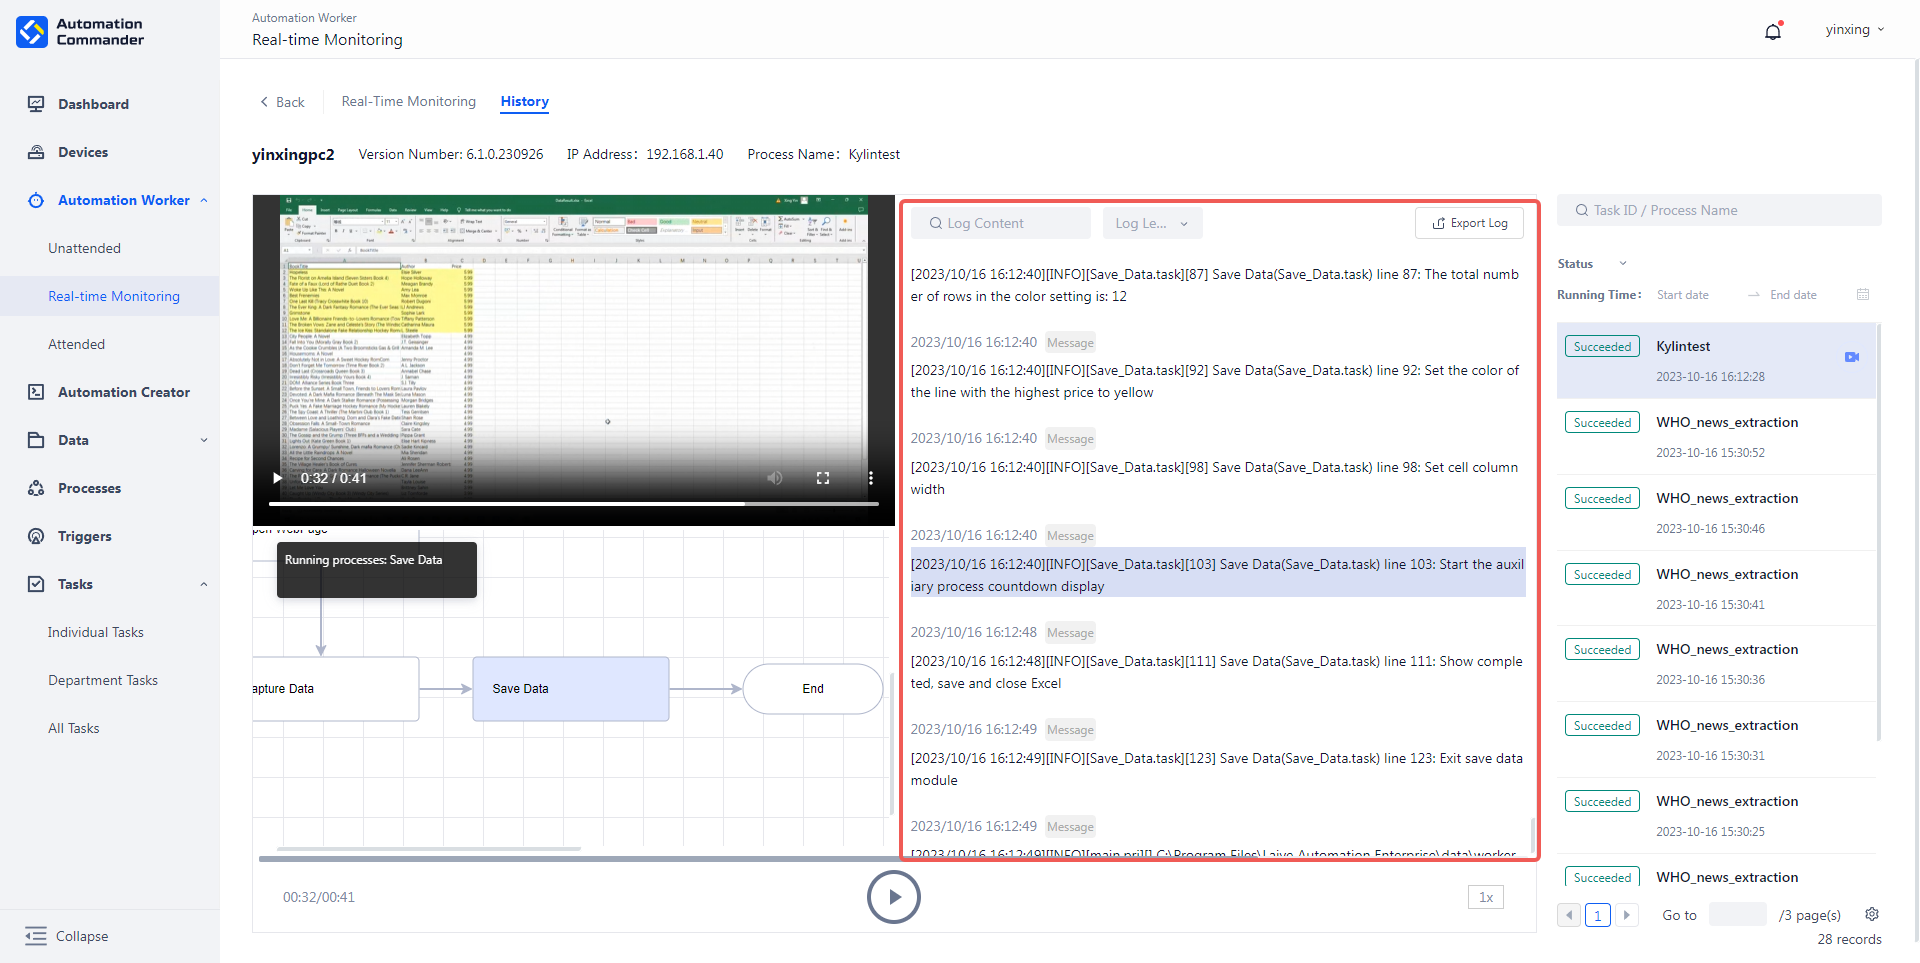
In the log display area, you can scroll using the mouse wheel or drag the slider on the right to view all logs.
Hover over a log entry to view its detailed content.
Click on a log entry to highlight it, and the recording and flowchart will switch to the corresponding position for that log.
At the top left corner, you can search all log content using keywords.
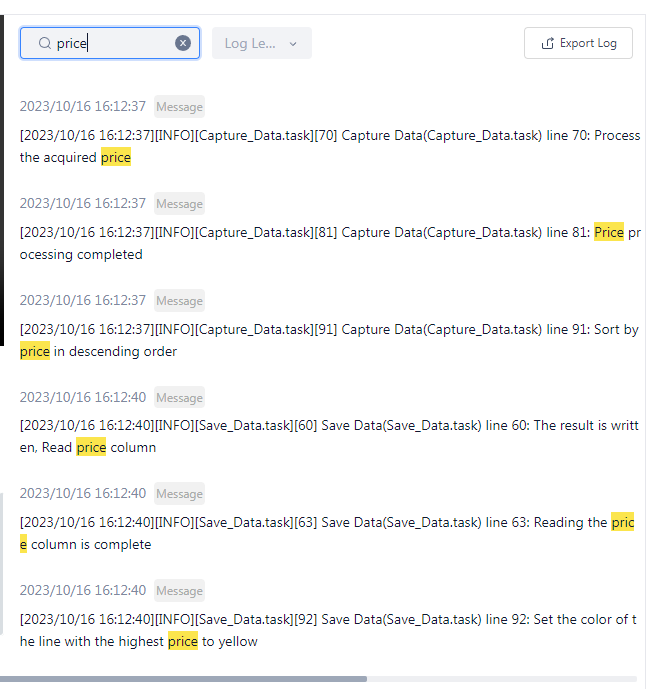
You can also filter logs by "Log Level" to display specific types of logs.
Click "Export Logs" to export task logs as a CSV file to your local device.
- Flowchart
The top left corner of the flowchart window displays the names of the currently running main process and sub-processes.
In the flowchart view, you can drag the canvas using the left mouse button or use the sliders on both sides to navigate.