Dashboard
Dashboard
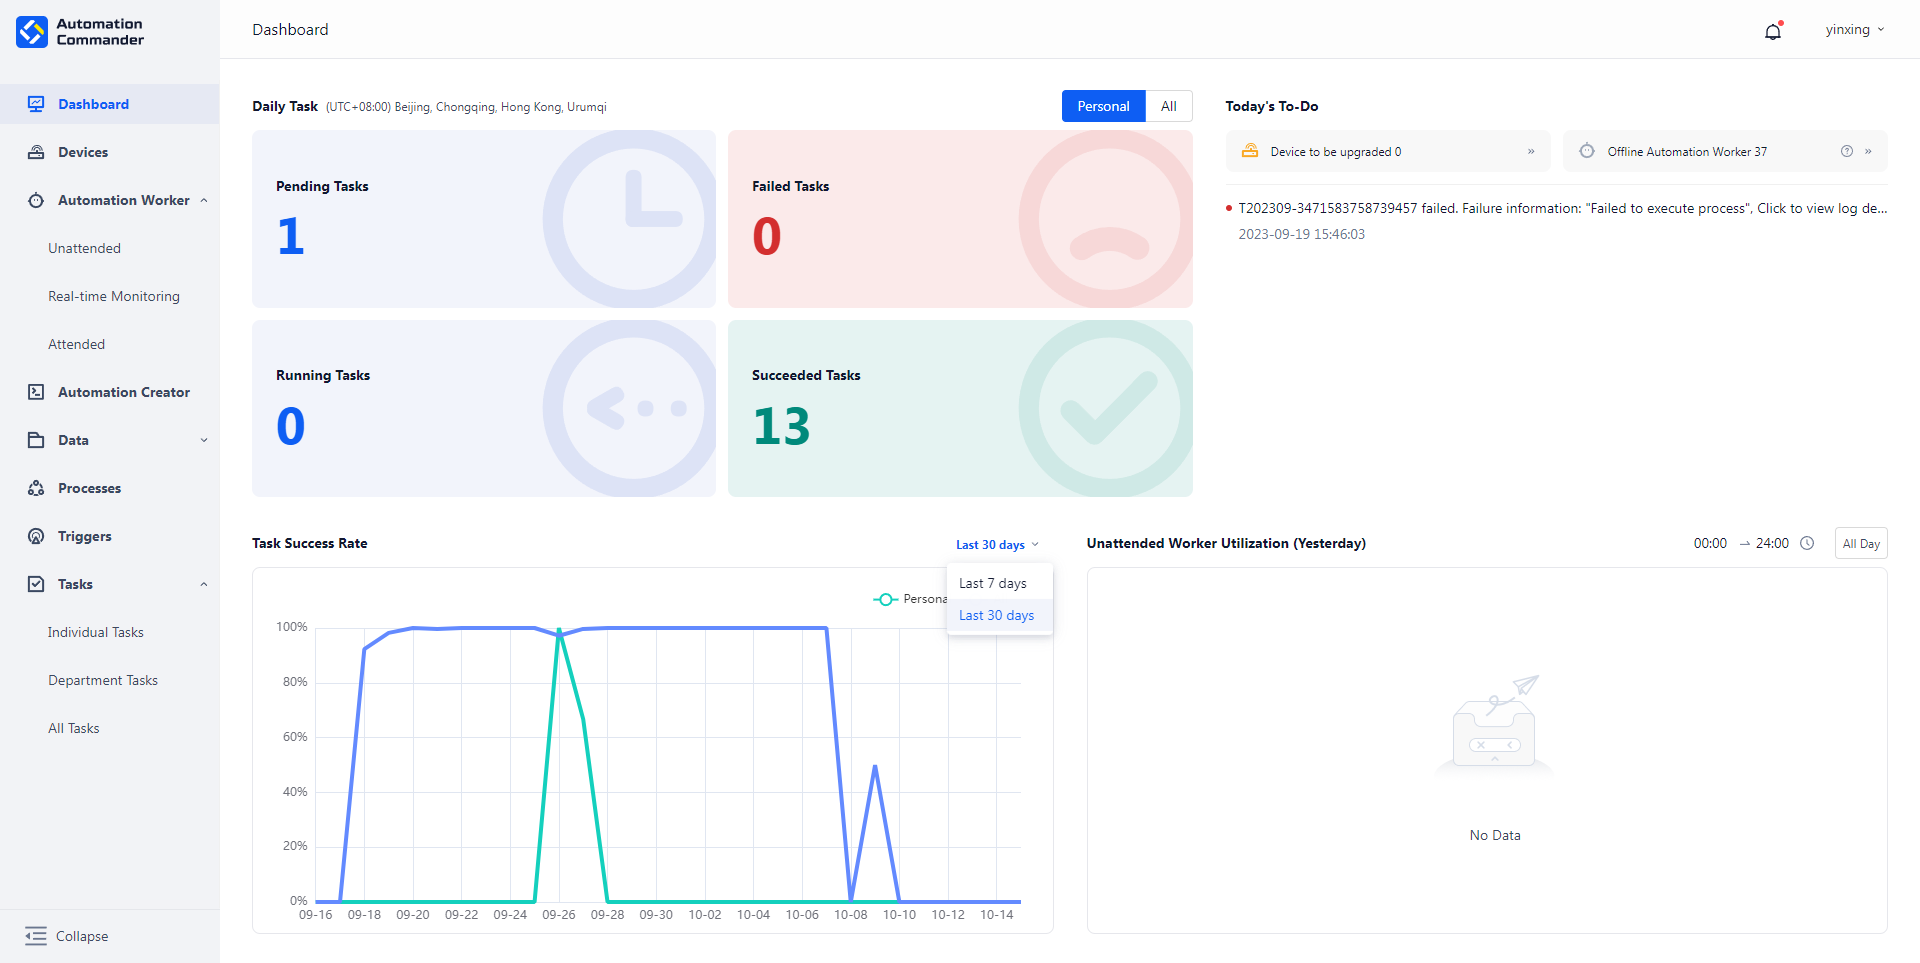
The "Dashboard" page is the homepage upon entering Automation Commander. On the Dashboard, you can intuitively view the execution status of tasks related to you, pending items, task success rate, and the activity level of Unattended Workers.
Today's Tasks
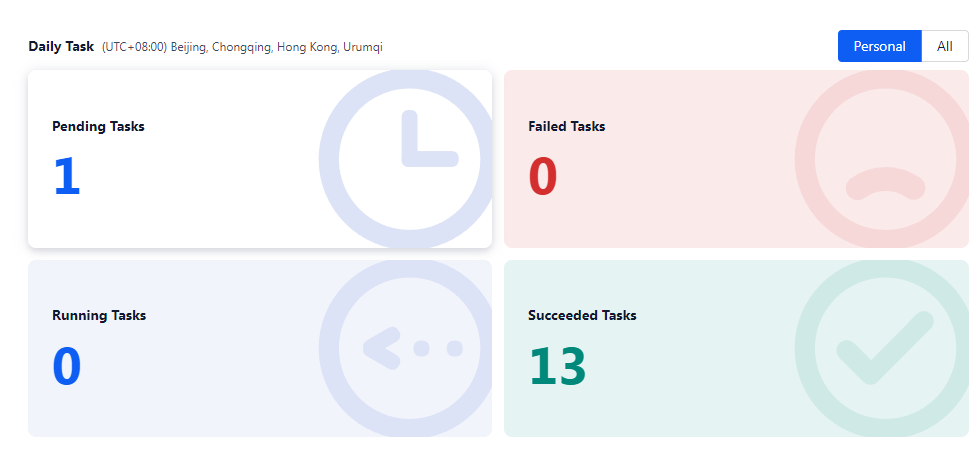
Today's tasks include statistics of pending tasks, failed tasks, running tasks, and successful tasks. The definitions of each indicator are as follows:
| Indicator Name | Description |
|---|---|
| Pending Tasks | The total number of tasks awaiting execution by the current user. Click to view details. |
| Failed Tasks | The total number of tasks run unsuccessfully by the current user. Click to view details. |
| Running Tasks | The total number of tasks currently being executed by the current user. Click to view details. |
| Successful Tasks | The total number of tasks run successfully by the current user. Click to view details. |
Note: The above data is calculated based on the time zone of the current user, from 00:00:00 to 23:59:59. The chart's top-right corner allows switching between "Personal" and "All Tasks" display. "Personal" shows statistics for the current user, while "All" reflects statistics for tasks within the user's permissions.
Clicking on the respective statistical data will redirect you to the Individual Task page for detailed information.
Today's To-dos
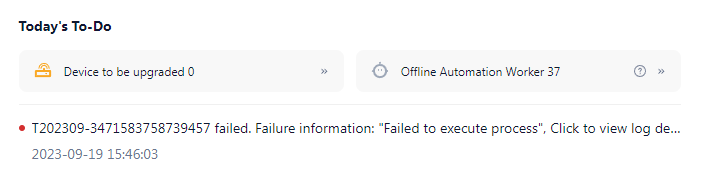
Displays the items you need to address today, including devices pending upgrades, offline Automation Workers, and unread system messages.
Devices pending upgrades refer to device clients with versions lower than the latest version of the system. Click to navigate to the device management section for device upgrades. For more details, refer to the "Device" operation instructions.
Data Cards
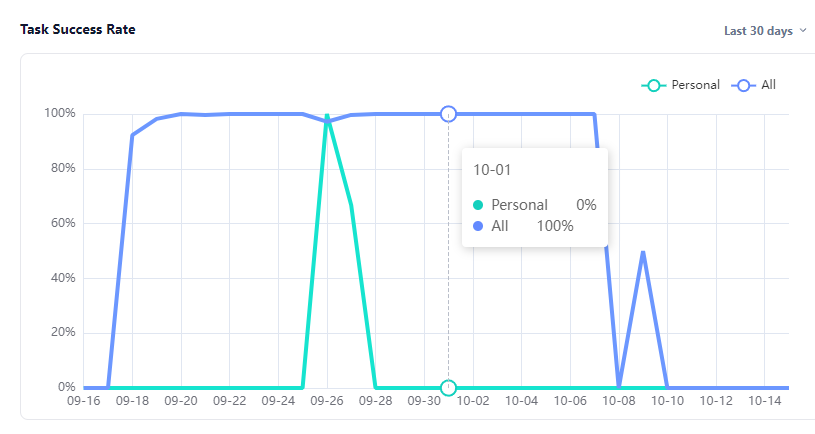
Data Card - Task Success Rate
Displays the average success rate of Individual Tasks over the past 7 days. You can click the card's top-right corner to switch to view the average success rate for the past 30 days.
| Indicator Name | Description |
|---|---|
| Task Success Rate | The percentage of successful process runs out of the total runs (successful runs + failed runs), rounded to two decimal places. |
| Last 7 Days | Task success rate data from yesterday to 7 days prior for the current user. |
| Last 30 Days | Task success rate data from yesterday to 30 days prior for the current user. |
Note: The above data is calculated based on the time zone of the current user.
Data Card - Yesterday's Unattended Worker Activity
Allows users to view the activity level of Automation Workers within their permissions over the past 24 hours.
| Indicator Name | Description |
|---|---|
| Activity Level | The percentage of time workers spent running tasks out of the total hours in a day. |
Personal Center
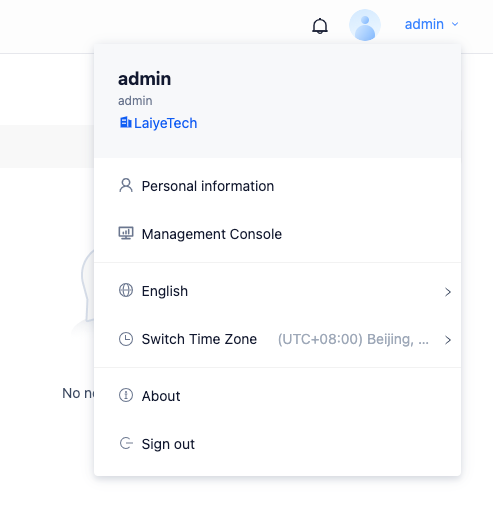
On any main menu screen, you can click on your member name in the top-right corner to configure settings related to your account or the current environment, as well as access the Management Console (available to administrator users only).
Personal Information
On the "Personal Information" page, you can view your name, organization name, and email information.
Clicking the edit icon next to the email allows you to modify the email address. Note that email verification is required for email changes, and the Multi-tenant Management Backend must have the email notification server configured. If you do not receive a verification email upon modifying your email, check whether the email was filtered or blocked, or contact the administrator to confirm the email notification server is correctly configured.
Clicking the "Change Password" button allows you to update your password. You must enter the current password and the new password twice. Once the password is successfully changed, your account will automatically log out, and you'll need to log in again using the new password.
Clicking the "Profile Picture" icon allows you to update your profile picture. Note that if it's your first time updating the profile picture, you must log in to the Automation Commander platform again for the changes to take effect.
Management Console
If you have access to the [Management Console], you'll see the [Management Console] menu in the Personal Center. You can manage members, organizations, configurations, authorizations, and logs within your organization via the [Management Console]. Clicking the [Management Console] menu in the Personal Center will open the organization's [Management Console] page in a new tab.
Language Switch
This section shows the language currently selected for system display. You can click to switch to another language. The system will refresh the page and display in the newly selected language. Currently, Automation Commander supports English and Chinese languages.
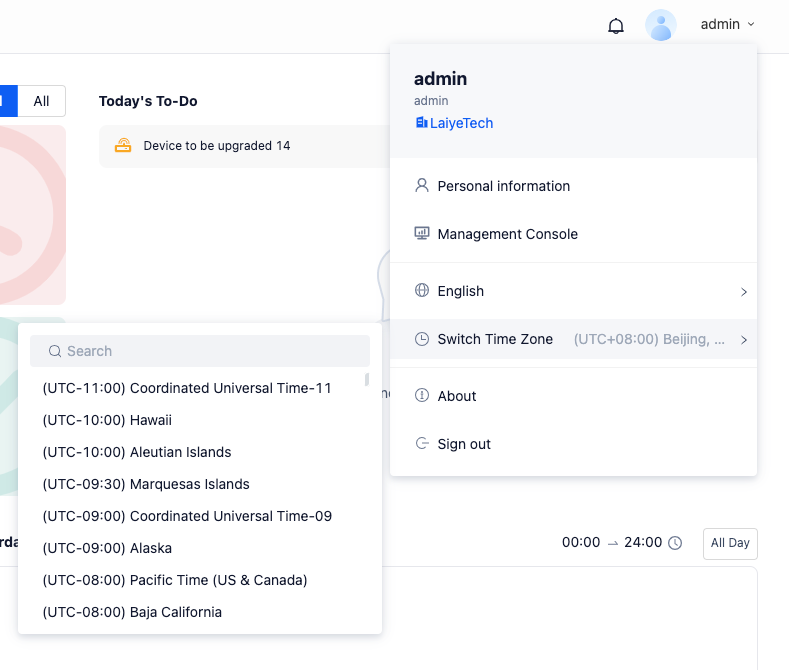
Time Zone Switch
Hovering over the [Switch Time Zone] menu will display available time zones. Click on any time zone to switch to it.
The currently set time zone will be displayed in blue font in the list.
Note that switching the time zone only affects the current user and does not impact other users.
About
Clicking "About" allows you to view the current version of Automation Commander and access Laiye Technology's contact information, official website, user agreement, and more.
Logout
Clicking the "Logout" button will log out of the current account.
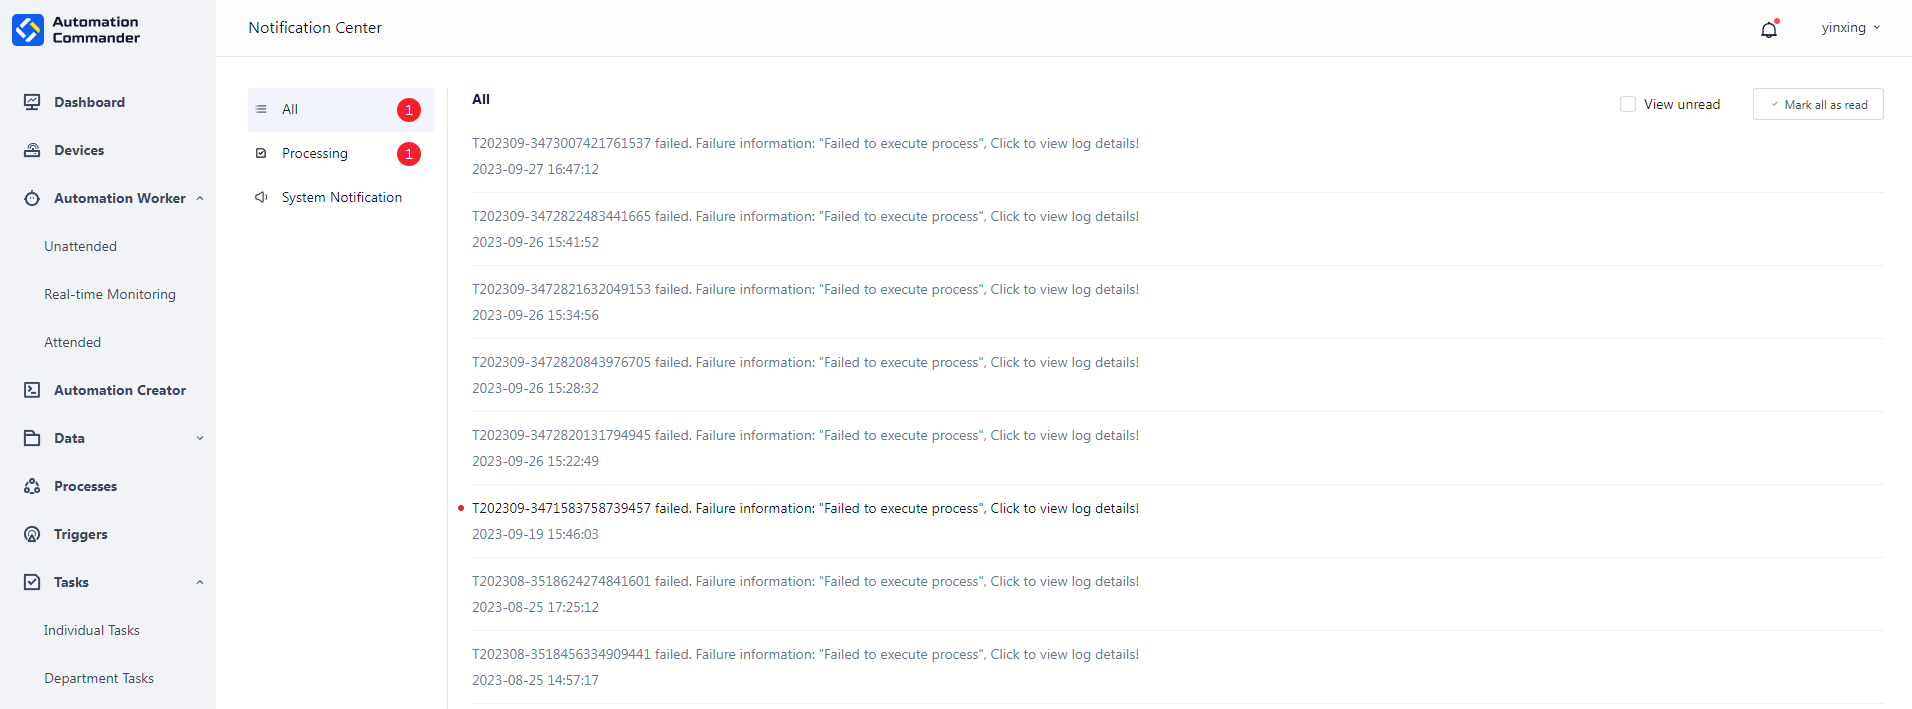
Message Center
The bell icon in the top-right corner of all main menu pages in Automation Commander represents system message notifications. When there are unread messages, a red dot appears on the bell icon. Clicking the bell icon lets you view recent unread messages. Clicking on an individual message redirects you to the page indicated by the message.
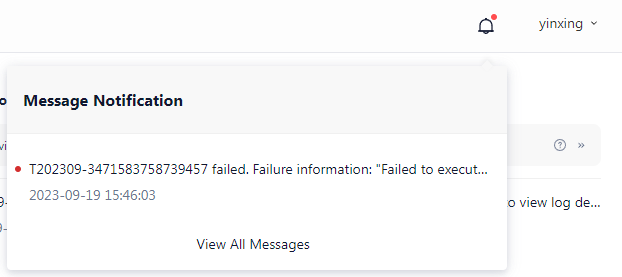
At the bottom of the message popup, clicking "View All Messages" allows you to view historical messages. The interface for viewing all messages is shown below.